Hey welcome to another week of my blog. Today I will be doing a design of experiment entry. I have learnt quite a number of things regarding design of experiment, it is crucial to use it as it is the backbone of any product design, without it no products or prototype would work! Since I was given a role of COO, Chief operating Officer, hence task 2 was given to me while the other 2 of my groupmates were given task 1. I was in charge of doing task 2 alone.
Task 2👅, Documentation on full factional data analysis
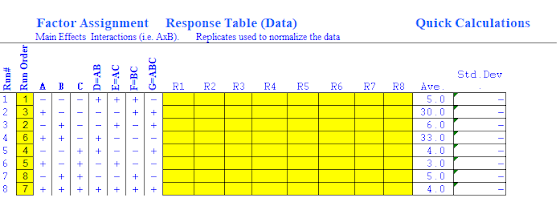
Before I begin anything else, I take a look of the data that was given to me in the task 2 that was given to me and here is the table of results that were given.
1. I did exactly the same thing as what I have learnt the week before, where I took the excel template as reference. The boxes R1-R8 are not filled mainly because the value given in the table above is assumed as it is given in averaged value, hence only ave. box was filled with respective numbers as shown below.
2. After that I filled up reference key to factor selection area so that I know which factors were used for each respective alphabet.
- Factor A: Concentration of coagulant, where 1% is low and 2% is high
- Factor B: Treatment temperature, where 72o
F is low and 100o
F is high
- Factor C: Stirring speed, where 200 rpm is low and 400 rpm is high
3. After entering all the respective values into the table as shown above, the excel sheet will auto calculate the values for us for significance of main effects. The values will be as shown below. Since only factors A, B and C are used, the rest of the factors are not needed to be shown.
4. Next, used the values from the above picture to plot a graph using excel functions. Simply insert the table inside after selecting the values.💧From the graph above, it is concluded that the most significant to least significant is C, A then B. C has the most significant effect to treat the waste-water to produce clean water. The higher the stirring speed hence more amount of pollutant discharged.
Factor A is the second most significant as the greater the concentration of coagulant added, the discharge flowrate of pollutant decreases overtime. Lastly, B is the least significant as it has less steeper gradient as compared to Factor A.💦
5. After the overall factors were done, data analysis for full factorial design interaction effect was made where all the runs values from the table were used.
this is done to find out if there is much or no interaction between each factor. Since each factors affect the other factor differently, it is important to find out the optimum factors that can pair well together.
6. The first data analysis for full factorial design interaction effect are A x B. I type out the values into a table, so I could see the numbers clearly. The graph, tables and values are as shown below.
from the graph above, both lines are different by a little margin. Therefore the interaction between A and B is small. Since the lines are not parallel, there is an interaction.
7. The next data is A x C, the calculation, table and graph is as shown below.
From the graph, both lines are very different as one is positive and the other is negative. Therefore, there is significant interaction between A and C.
8. The next data is B x C, the calculation, table and graph is as shown below.
Data B x C is quite similar to that of data of A x B as the gradients for B and C & A and B are relatively similar to one another hence the interaction is very minimal due to small difference margin gradient.
Conclusion interaction of A and C is the most significant
Documentation on fractional data analysis
I have chosen
This is because all of the factor will appear same number of
times for high and low.
Link for both documentation: https://docs.google.com/spreadsheets/d/1T8SX03bVMx5ALqmFjdzM7v-OoA9t6Z4N/edit?usp=sharing&ouid=102008827362868091617&rtpof=true&sd=true


Comments
Post a Comment